FusionReactor 8.7.4 released, now tracks JDBC time, etc. much more noticeably
Note: This blog post is from 2021. Some content may be outdated--though not necessarily. Same with links and subsequent comments from myself or others. Corrections are welcome, in the comments. And I may revise the content as necessary.FusionReactor version 8.7.4 was released recently (Oct 28. 2021), and while the release notes list several improvement (and a few bug fixes), I want to highlight in particular a couple of new features.
TLDR; The first improvement is one I've been looking forward to for years: the display of JDBC time spent and time spent calling out to remote services on the pages that list requests, like active/longest/slow requests. This will really speed up assessment of the reason of slowness in listed requests. See the screenshot below, and still more as well as another new feature.
Tracking DB time, cfhttp time, etc on request list pages
First up, if you've used FR's page that show requests (Requests>Activity, or >History, or >Slow Request, or Longest Requests, for instance), you may have noticed that on the right there is a column that has long shown the duration of the request. Perhaps less obvious was the fact that this column actually held TWO values, with the second one (under the duration) being the CPU time spent in that request. As interesting as that may be sometimes, in my experience nearly all slow requests are not slow due to CPU but rather due to database (JDBC) activity, or perhaps calls out from the request to other servers/services from within the request.
Until this new change, that wasn't easy to readily observe. You would have to know that you could go into the request's details page, and there see on the bottom right that there was info on the number of JDBC calls, the total time JDBC spent, etc. Then you may know that at the top of the request details page was both a tab showing (by default) the top slowest JDBC activities and another called "Relations" tracking such things as calls out to other servers/services from within the request (and also JDBC activity).
But as of 8.7.4, it's MUCH easier to find that information. There is a new column right on the request list pages for "DB" and "Service" time--which appear to the right of the original request duration column previously labeled "Time" but which is now labeled "Total & CPU". See the screenshot below:
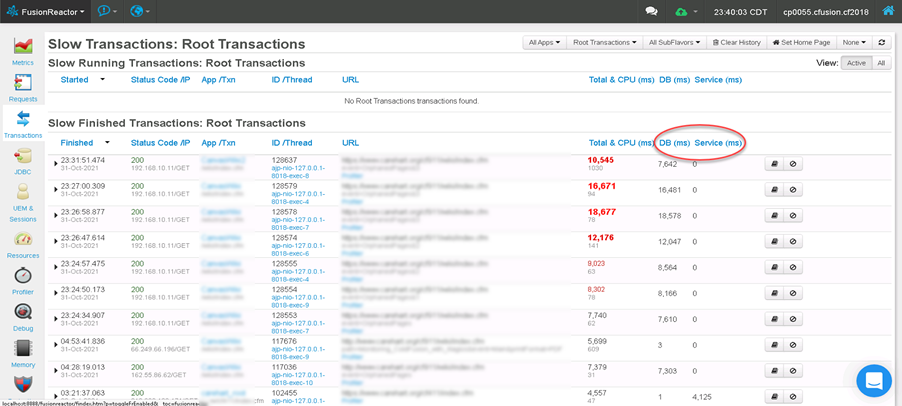
In my example shown, I happen to be showing a Requests>Slow Requests page, but again any request page will now show these new columns.
And you can readily see that most are slow because of DB time (equal almost to the total duration in most of the request), while the last one instead shows its slowness to be mostly in "Service" time, and on drilling into that page's details, I could see in its "Relations" tab that the time was indeed due to an http call out of the page (a cfhttp call in CFML, or it could be an httpclient call in a Java app.) You could look at your request's details page and its Relations tab to see what the "Service" time was about.
Again, as for most of the rest where most of the time is DB time, it's great to see that so readily. If I wanted to drill into to the request details and its JDBC tab, I could then know exactly what queries were slow.
Finally, if ever the total time is much longer than the DB time and Service time together, then clearly something ELSE must explain the slowness. In that case, if you're running the FR Ultimate edition (or free trial), that's where the FR "Profile" feature (also offered as a tab on the request details page) can help you spot where slowness happened within the request.
Granted, it's taken me time to discuss the new feature here, and it really is "just a couple of new columns", but sometimes "it's the little things"! :-)
Another helpful improvement: more easily increase the length of SQL tracked
The next one is also a "little thing". As I said at the opening, the release notes lists a few other improvements--which I'll leave you to look into, as most address rather unique needs, but I will note one more that may benefit a wider percent of users.
You may have noticed that when you go to the JDBC tab, while in a request details page, the length of the SQL statement shown will be truncated if it's lengthy. The number of characters shown can be configured with the JDBC>Settings>Logging page (and its last setting). As of this update, when a SQL statement is truncated, the display will offer the following helpful text:
"This JDBC Query has been truncated. To see the full query, you can adjust Statement Text Limiting within the JDBC settings"
Obtaining the FR update
As for obtaining the FR update, there are a couple of ways.
First, if you are running FR 8.1 or above, you will be told in the top banner of the FR UI when there is an update above the version you are currently running. You can click the link offered to obtain the update.
Or you can visit the FR downloads page. Either way, you will see there the options to either obtain just the FR jar (to use if you prefer to manually configure things) or the full installers (available for multiple OSs, and either as GUI or command-line installers).
For more on applying updates, see the FR documentaiton, or see a post I did on Keeping your FusionReactor updated. You may want to see also past posts I've done about various FR updates, such as 8.7.3, 8.7.2, 7.3, and others.
For more content like this from Charlie Arehart:Need more help with problems?
- Signup to get his blog posts by email:
- Follow his blog RSS feed
- View the rest of his blog posts
- View his blog posts on the Adobe CF portal
- If you may prefer direct help, rather than digging around here/elsewhere or via comments, he can help via his online consulting services
- See that page for more on how he can help a) over the web, safely and securely, b) usually very quickly, c) teaching you along the way, and d) with satisfaction guaranteed


There are no comments for this entry.
[Add Comment]