FusionReactor 9.2.2 released Mar 1 2023, can track query cache count per app, fixes memory issues
For some, that news is all they need to hear. For others, read on for more details (including why the delay in my announcing this).
First, apologies for being two months behind in sharing the news. Better late than never, right? Unfortunately, the week it came out I was quite busy helping people who were being hit by the CF security vuln which was later addressed by the March CF updates, and then I was helping people with that. And then there was the CF Summit East which I spoke at, and I just fell behind on some other things like this.
Other ways you might learn there was an FR update
Second, while anyone using a modern install of FR would get a notification in the on-prem (and/or cloud) UI about there being a new version, sometimes people just don't notice/pay attention or just maybe don't enter the UI very often, and that's why I like to do these posts to share the news.Of course, if you visit the link to the release notes page (which is offered via a button on the downloads page), you can see also both what updates have happened and a brief list of what features have been added, and what improvements or bug fixes have been made. (And since the 9.2.0 release, they also now track on that release notes page the date that the update was released, which was a request I'd made--so thanks, folks!)
As for FR's own blog (offered via the "Resources" menu at the top of their site), that does offer a LOT of content I have not seen a post on FR 9.2.2 there, either. (Frankly I find their blog to have too much info, with a lot of content that may be great for bringing in outsiders to find the FR site and so FR itself, but most of it is not specific to FR and it's not easy to find only posts about FR itself.)
What was added/changed in 9.2.2, in brief
Anyway, as for the 9.2.2 release, here first are the bullet points from the release notes. They're rather spartan, and there's not any page we can be pointed to that might tell us more about the issue "key" or ticket number. That's for an internal system only, it seems.Even so, some people may readily discern what the points are about and whether they apply to their use of FR or integration with other things:
| Key | Issue Type | Summary |
|---|---|---|
| FR8400 | Improvement | Prevent JSONInterposer from writing to a byte array when disabled |
| FR8401 | Improvement | Set status on spans |
| FR8402 | Improvement | Disable CF metrics by default to reduce performance impact |
| FR8403 | New Feature | Implement new ColdFusion metric for the amount of cached queries per application |
| FR8404 | Bug | Fix the filepath label which prevents Windows log shipping |
| FR8405 | Improvement | Reduce the size of JDBCRequest spans. Disable db.user by default |
There are just a couple of those I'd like to elaborate on a bit.
Significant change 1: Reduction in unexpected heap memory in CF2021 or 2018, since FR 9.2
As for that 3rd bullet above, you'd be forgiven for not knowing that this heading is the gist of that, "Disable CF metrics by default to reduce performance impact". Let me explain.
In FR 9.2, the FR folks started leveraging a feature within ColdFusion to track some new metrics...which then got enabled and passed into FR to be tracked. Indeed, the release notes for 9.2 shows this as merely, "The CF metrics graphs and CF system metrics graphs now have all metrics in ColdFusion 2021" (it also applied to those running CF2018). But a blog post I did at the time offered more detail, of course, including about some of what this new monitoring enabled.
But within days/weeks/months of that Jan 2023 release, folks using either of those CF versions with FR were starting to experience it using excessively larger amounts of JVM heap memory (and therefore OS memory) than it had before...and they would not have readily connected it to their having implemented a new FR version.
Normally the FR folks are VERY careful about any new FR feature using memory. But this was an unexpected combination of factors (and caused as much by the CF feature as by the FR enabling of it--and it was limited only to CF2021 and 2018, as it relates to some internals that are new to that since those versions also offer the CF Performance Monitoring Toolset or PMT). So the necessary combination of factors just must not have been obvious in the testing the FR folks did.
As people reported it, the FR folks did quickly identify the problem...
A first resolution, before 9,.2.2
And at first they even offered (to those who asked about it) a JVM arg to control the feature:
If that was set to false, the new monitoring would stop. And for those with the memory problem, it went away. (To be clear, this does not do what you may think: stopping ALL monitoring of CF from within FR. No, it's just this NEW monitoring behavior that was added in 9.2, as I mentioned in the previous post on that update.)
The changed behavior as of 9.2.2, and new JVM args to control the behavior
Now as of FR 9.2.2, they have both added new arguments (to control things more carefully) AND defaulted those to false which has solved the memory problem that was happening to some folks. So again simply moving to 9.2.2 may help you if you had this heap memory problem since moving your CF2021 or 2018 instances to running with FR 9.2 or 9.2.1.
But for those who MAY want to turn on this "new" monitoring again, they added new JVM arguments which provide more refined control of this new CF monitoring. Again, these are off by default:
fr.coldfusion.monitor.memory.enabled
fr.coldfusion.monitor.query.enabled
fr.coldfusion.monitor.query.app.enabled
And FWIW these are listed on the page of configurable FR JVM system properties (they are currently at the very bottom).
As for what benefits you'd get with these enabled, again I discussed them some (including screenshots) in my post from when 9.2.0 came out. As for the last of those 4 indicated here (that's something else that's new in 9.2.2, which I will discuss in a moment.
First, what if you don't want to configure things via jvm args?
New UI elements to control that behavior
Related to the above, they have also changed 9.2.2 to let you control those CF monitoring features via the classic FR on-prem UI, for those who may prefer that to tweaking JVM args.
See the FusionReactor menu (in the top left corner, as indicated by the top arrow in the screenshot here), then choose "Plugins">"Active Plugins" then find the "FusionReactor ColdFusion Plugin" listed on that page, and click the "configuration" button on the far right of it. 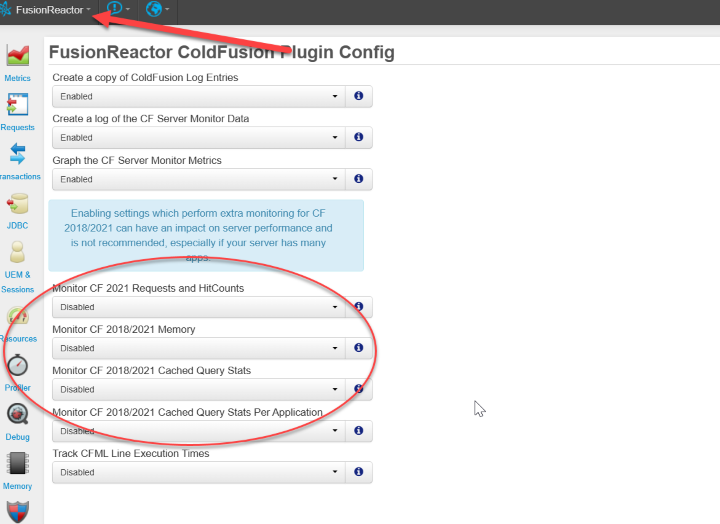
That will open a page offering among other things, "Monitor CF 2021 Requests and HitCounts", "Monitor CF 2018/2021 Memory", "Monitor CF 2018/2021 Cached Query Stats", and "Monitor CF 2018/2021 Cached Query Stats Per Application". Again they are all "disabled" by default. And to be clear, prior to 9.2.2, the other 3 options listed above those (and indeed the last one listed below them) were all there on that page previously.
Again, as for the last of those 4 new options indicated there (and the last JVM arg listed in the previous section), that's something else that's new in 9.2.2, which I will discuss in the next section.
Significant change 2: Optional tracking of CF query cache counts *per application*
Before I discuss the new feature of optionally tracking CF query caching *per application*, let me set some context about FR's tracking of cached queries at all.
And for the sake of some readers, I'm referring here to whether and how FR tracks when any CFML requests have used CF's query caching feature, such as is offered via the cachedwithin or cachedafter attributes of cfquery, cfstoredproc, or their script equivalents.
(Furthermore, let me share that for readers using FR with Lucee, note that FR does not currently track query cache counts at all for you, because again it's leveraging tracking that CF does, which FR simply reports. To be clear, the tracking is in FR on-prem's Metrics>CF System Metrics page, which does not exist if monitoring Lucee with FR .)
About the improved tracking of query cache counts (for CF2018 and above) which came with FR 9.2
One of the things I discussed in that last blog post (on FR 9.2) was that while FR had long had a graph to track the count of use of cached queries (in total, across all applications), as offered in that Metrics>CF System Metrics page, that tracking had stopped working since CF2018--because of changes in CF. And part of what 9.2 did change was to start tracking that query cache count again, as I showed in a screenshot of that in the previous post.And sadly, that's indeed one of the things that's now turned off by default (again) as of 9.2.2, though I should say that I don't think the query cache tracking was itself a terrible performance impact. I just think they "threw the baby out with the bathwater". That said, if you stored your cached queries in Redis, there was a different fix for that as offered in 9.2.1, as I blogged about when it came out).
The change as of 9.2.2: new graphs tracking query cache counts per app
Anyway, as of 9.2.2, if you DO enable that query cache monitoring, you can now go a step further and ALSO enable FR tracking the query cache count on a PER APPLICATION basis, so that a new graphs would appear on that Metrics>CF System Metrics page: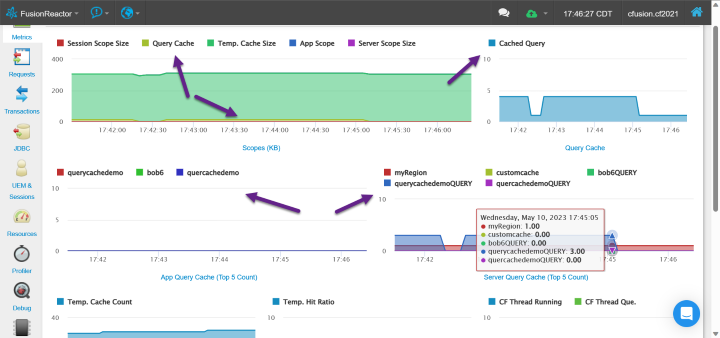
Some will notice there are two new graphs added to the page (the second two), but note the first arrows in my screenshot. Those point to how, if the "Monitor CF 2018/2021 Cached Query Stats" option is on, then the total count AND size of the use of query caching (across the CF instance) is tracked.
As for the second two graphs, those are what now track the count of query caching PER APPLICATION. And note first that instead of tracking ALL apps (which could get unwiedly), they opted for showing only the top 5 apps with the largest count of cached queries. And you can see the names of the apps in my demos, being "querycachedemo", "bob6", and "quercachedemo" (a typo,which I corrected and created correctly as querycachedemo.
This also demonstrates the point that the list of apps will not go away even if there are 0 cached queries for that app (at least until some new app has a large enough count to bump it off the graph). Similarly, if you restart CF, there will be only that right graph, "Server Query Cache", and it will have nothing but a default "customcache" listed in its legend, again until some query caching starts.
BTW, I have not been able to discern what the difference is between the "App Query Cache" and the "Server Query Cache" graphs, but I didn't want to hold up getting this post out. Perhaps a reader or someone fro Integral may be able to offer a clarification, and I'd correct this post.
Finally, note how you can see the COUNT of each graph either via observing the y axis or just mouse over a datapoint in the graph, as is reflected in my screenshot.
Again, if you DO want to see this tracking of cached query counts per application, you will need to enable BOTH those features I listed above, "Monitor CF 2018/2021 Cached Query Stats", and "Monitor CF 2018/2021 Cached Query Stats Per Application", whether via the UI or via the equivalent JVM args in the earlier section.
So there you go. As often happens, there's a lot more to what's new than those single bullet points would convey! :-) And there may well be more one could say about the other bullet points, but I am not aware of their details so I will leave it at this. Enjoy.
For more content like this from Charlie Arehart:Need more help with problems?
- Signup to get his blog posts by email:
- Follow his blog RSS feed
- View the rest of his blog posts
- View his blog posts on the Adobe CF portal
- If you may prefer direct help, rather than digging around here/elsewhere or via comments, he can help via his online consulting services
- See that page for more on how he can help a) over the web, safely and securely, b) usually very quickly, c) teaching you along the way, and d) with satisfaction guaranteed