FusionReactor 8.7.7 released, enhances the recent DB and API Time feature
Note: This blog post is from 2022. Some content may be outdated--though not necessarily. Same with links and subsequent comments from myself or others. Corrections are welcome, in the comments. And I may revise the content as necessary.I had blogged in early November about how FusionReactor 8.7.4 had added at that time a new feature where it lists on request summary pages the DB and API Time of each request, so you could readily tell how much of a request's duration might have been caused by time spent waiting for either of those kinds of resources.
Now in 8.7.7, which was released last week (Mar 1), the benefit of that feature has been extended so that a) the same information is written to both the FusionReactor request logs and b) it's also now available in FR crash protection alert emails. In this post, I'll show you examples of what's changed for each, and I'll note another related changes in the prior FR update, 8.7.6.
New columns for DB and API time in the Request Log
Here's an example first of the new columns in the request log, for a request which had 4.4 seconds (4438 ms) of API time. (I've removed a couple dozen columns in the middle of the line.) Notice how the last two columns in the log line now reflect the DB and API Time, appearing after the user agent:
Related to this, I'll note a bit of a gotcha: as of 8.7.6, the FR Archived Metrics feature for displaying the FR request log in its default display in "Spreadsheet" view does not currently includes these two new columns. (You can, of course, see the new columns in the "Text" view, which shows the actual request.log file content itself.) I have reported this problem to the FR folks and they plan to address it soon.
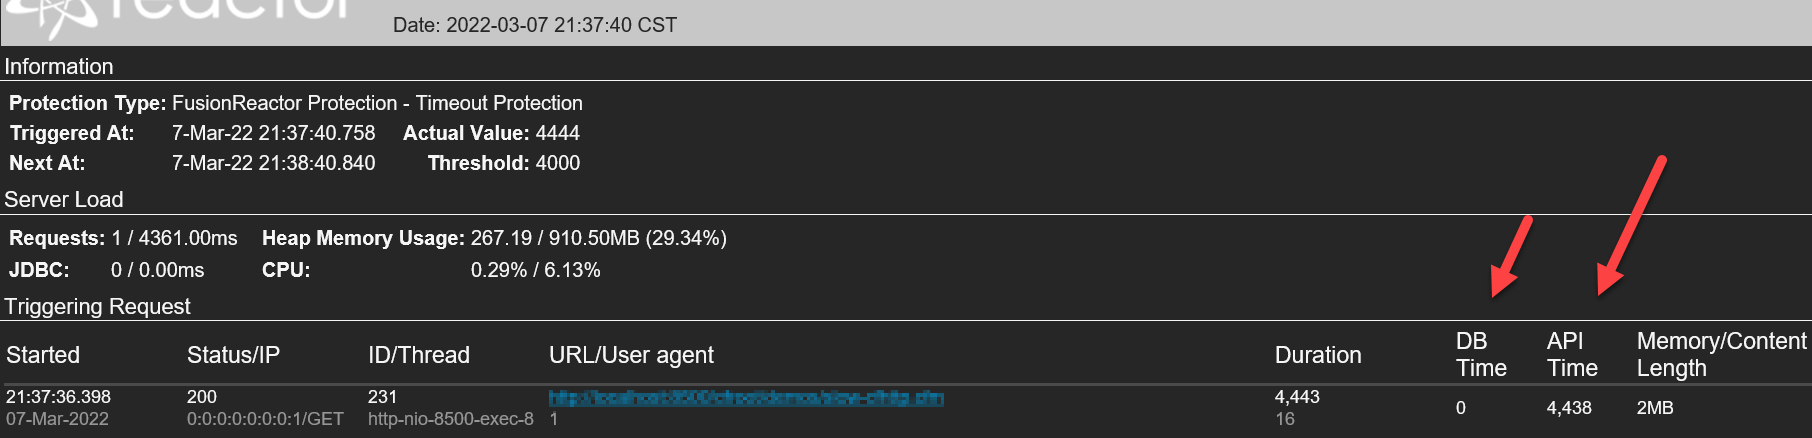
New CP alert email columns for the DB and API Time
The second aspect of this new feature set in 8.7.6 will be available to you if you setup FR CP alert emails: the list of requests at the top of the alert (the "triggering" or "running" request lists) now also offers these new cols for DB and API Time, displayed to the right of the request "Total Time".
Here's a screenshot from the top of such an FR CP alert email, showing the same request as above, along with the new columns pointed to on the right:
This matches the FR on-prem UI request summary pages, as I showed in the November blog post when the feature was added in FR 8.7.4. (They are also shown at the top of the details page for a request or transaction, which I'd not noted then.)
A couple of minor changes about these columns in the previous update, FR 8.7.6
FWIW, note that FR 8.7.6 (released in Dec 2021) included a couple of modest changes related to this feature of the DB and API Time columns: first, what we've referred to as "API Time" had been called "Service Time" when it first came out in 8.7.4, but in 8.7.6 it was renamed to "API Time". Second, as of 8.7.6, the "API Time" now includes CFML cfhttp time.
What's included in DB and API Time
Indeed, while on that topic of what's included in these times, let's take a moment to note that the "DB Time" column includes not just the time spent in JDBC processing but also other DB resource usage time, such as MongoDB, Redis, Elastic and Cassandra. As for API time, it includes cfhttp calls in CFML and httpclient calls in Java, as well as calls to http clients OKHttp, Micronaut, Vertx. (For now, it does NOT include calls to soap web services, such as CFML offers with cfinvoke, cfobject, and createobject. One could argue that the term "API time" would make more sense if it included other such calls besides http.)
Summary
In summary, again the inclusion of these DB and API times in the request summary pages of the FR on-prem UI (and in the "tracing" tab of a request in the FR Cloud UI) helps to readily identify whether the duration of a requests is made up of these kinds of resource usage times. Sometimes this can enable you to avoid needing to look into the request's details page.
Now the inclusion in 8.7.7 of these DB and API Times in the FusionReactor request log and FR CP Email alerts makes post-mortem troubleshooting all the more effective.
(FWIW, there were some other important changes in another previous update, FR 8.7.5, which I never blogged about. I hope to do that in a follow-on post soon.)
For more content like this from Charlie Arehart:Need more help with problems?
- Signup to get his blog posts by email:
- Follow his blog RSS feed
- View the rest of his blog posts
- View his blog posts on the Adobe CF portal
- If you may prefer direct help, rather than digging around here/elsewhere or via comments, he can help via his online consulting services
- See that page for more on how he can help a) over the web, safely and securely, b) usually very quickly, c) teaching you along the way, and d) with satisfaction guaranteed


I'd also love to see all this new DB and HTTP timings available on the "Main" tab for a transaction. All we have is "JDBC" ATM which is only part of the picture.
As for your second paragraph, those two colum s ARE indeed shown at the top of the page when viewing a request's details page (or the that for a transaction). It's not in the "main" tab, per se, but it seems adequate. Did you miss that, or do you disagree?
Finally, as for what the api time covers (your addition of micronaut, okhttp, etc.), I had in fact asked overnight for confirmation of that. I didn't want to hold up the post while awaiting the answer--which I'd in fact gotten before your comment here, but I'd just had not yet updated the post. I will now.
I'd also asked if it might ever include calls to soap web services (as cf offers with cfinvoke, cfobject, or createobject). That would expand things beyond "just http", to your point. But the answer was that it does not, for now. (As for why I didn't just test that myself, It was late last night as I was wrapping up and I was out of time. Again I didn't want to hold up the post for that rather minor point. I figured I'd have had time this morning to update it once I had the clarifications, which I'll do now.)
Yes, I've discussed with Mikey. It sounds like their reasons were mostly that people kept all telling them different things it should be called, so they went with whoever was yelling the loudest, lol. I still maintain "HTTP" time is the most appropriate name as it describes exactly what it is and makes no assumptions about the nature or higher-level semantics of the HTTP call.
> it seems adequate. Did you miss that, or do you disagree?
Yes, I saw them and yes I disagree :) Having them there is great, but it's still a half-implemented job. I LOVE the JDBC section on the "main" tab of a transaction as it has more detail than just the total (for starters, the NUMBER of JDBC calls can be a huge red flag). The "DB" time column includes JDBC AND MongoDB, Redis, Elastic, Cassandra so there's a lot more info than just JDBC that I'd love to be able to get that "high level view" of right there on the main tab before I dig into the other tabs. And the same for HTTP-- how many HTTP requests? What type? Average time? There's a lot of missing high level stats that I think deserve to be featured on that main tab. The two columns are great (other than the poor naming) but they're just the tip of the iceberg.
> your addition of micronaut, okhttp, etc.
Yep, my list came from my discussions with Mikey this morning.
> include calls to soap web services
SOAP web service calls, are still just HTTP requests. The fact that the high level semantics of the message request body and response body follow a SOAP (or even an XML-RPC) spec doesn't change that it's still just an HTTP call. Now, I don't mind if they provide a breakdown of the different types of HTTP calls, if it's even possible for FR to differentiate, but I would expect SOAP calls to be included in the "HTTP" column since that what they are.
And indeed, since http counts and details are in the relations tab, it does seem rather a nit that the count's not on the main tab also, but ok.
And as for web service calls being just another form of http, OK sure. My point was to let folks know that those are NOT currently tracked in the new api column, though it seems they should be.
Maybe they will hear you/us.