Ever find the ColdFusion Server Monitor "start" buttons missing? Just refresh...
Note: This blog post is from 2012. Some content may be outdated--though not necessarily. Same with links and subsequent comments from myself or others. Corrections are welcome, in the comments. And I may revise the content as necessary.Have you ever opened the ColdFusion Enterprise Server monitor, only to find that all the pods on the front page are blank? More specifically, have you noticed that the "start" buttons at the top are not there? See below for an example. The good news is that there's an easy "solution" to get it working correctly again.
This entry discusses the problem and solution.
The problem: what it looks like
If you've experienced this problem before, you know just what I mean. But if it's not yet happened to you, here's what we're talking about. Notice the red circled areas in the image (I'll explain the green arrows in a moment).
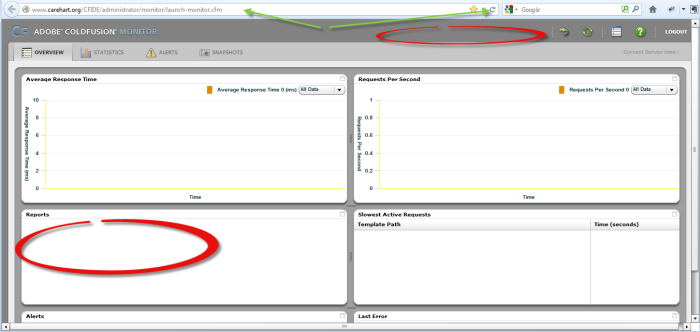
When this happens, there's no point in trying to proceed to look at any of the monitor's interfaces or tabs. It's not yet successfully talking to the server, so there's nothing it will be able to show other than the shell of the monitor's interface. (If it's just SOME pods that are blank and not all, that's a separate matter, which I'll discuss in a moment.)
The solution: refresh the page
The solution is to refresh the page (in the browser). That's not as obvious as it may seem on the surface.
You can't use ctrl+r or f5 or any typical browser refresh keystokes, because the Flash-based monitor interface has taken over the keyboard. I also don't mean the refresh icon within the Monitor interface.
I mean you should use your browser's page refresh features.
In the FF interface below, you can see I'm pointing to the refresh icon to the right of the URL (it's on the right as well in Safari and IE, and on the left of the URL in Chrome.) You can also put the focus in the address bar and hit enter. And these are the two areas I'm pointing out with the green arrows.
With the monitor now showing the start buttons, you'll see that at least the "Reports" area on the lower left also now shows information.
What about if the top 2 pods are blank?
As for the top two pods on the front page ("Average Response Time" and "Requests Per Second"), or the one on the middle right ("Slowest Active Requests"), if these are blank, that's not so much a problem, but just something to understand.
Those three pods on the front page depend on whether you've enabled the "start monitoring" button. If not, they are blank. But even if you have not enabled any of the 3 start buttons, there's still plenty of valuable information that the Server Monitor can provide.
More on the monitor in general, and these "start" buttons in particular
For more on the monitor, including more on the start buttons (and the implications of using them or not, or how their impact remains beyond closing the monitor, and much more), see the "Related Blog Entries" links below.
For more content like this from Charlie Arehart:Need more help with problems?
- Signup to get his blog posts by email:
- Follow his blog RSS feed
- View the rest of his blog posts
- View his blog posts on the Adobe CF portal
- If you may prefer direct help, rather than digging around here/elsewhere or via comments, he can help via his online consulting services
- See that page for more on how he can help a) over the web, safely and securely, b) usually very quickly, c) teaching you along the way, and d) with satisfaction guaranteed


There are no comments for this entry.
[Add Comment]